2018 State of the Community

Each year, Portland Women in Technology (PDXWIT) captures important data about the Portland tech industry, independent of company and group or association affiliation. Our goal is to deeply understand what it is like for people in the community and to identify themes that need to be addressed.

This year, what we found was stark, but not surprising.

We encourage you to use this data to propel change in your companies, and we’ve provided you with an action checklist at the end of the data visualization to support you in talking to your CEOs, bosses, colleagues and taking action yourself.

The Culture

Company culture continues to be a key factor in joining and staying with an organization. Many companies are talking about building diverse and inclusive cultures but whether or not talk is becoming action remains to be seen. Here’s what our survey respondents thought.

How would you describe your company culture?

Benefits Bubble Chart

Does your company have a transparent salary policy?

(Lack of salary transparency propagates pay inequities)

Do you feel that salaries are comparable for all genders at your company?*

Which of these benefits, if any, does your company provide?

Paid maternity leave

67%

Paid paternity leave

48%

Nursing room

55%

Flexible hours

72%

Remote working

70%

Onsite childcare

6%

Trans healthcare

22%

None of these

4%
It feels like I need to prove myself 100% just to get my foot in the door whereas men seem to be rated on their potential to learn the missing skills they don't have.

The Realities of Women in Tech

Despite diversity and inclusion efforts, women are disproportionately facing day-to-day inequities, including being asked to perform housekeeping tasks in addition to their regular jobs.

Which of the following have you experienced?*

Told you were too aggressive at work

33% Women
19% Men

Asked to order lunches, schedule events that was beyond your job scope

33% Women
6% Men

Suspect you were passed on a role because of your gender

24% Women
5% Men

Leaned on to be the den mother, counselor, admin because of your gender

42% Women
2% Men

In a meeting and felt gendered language was used that did not include you

46% Women
5% Men

No - I have not experienced any of these

25% Women
71% Men

What is the one thing you'd like to stop?

The Realities of Harassment

In the last 12 months...

17%
experienced harassment in their workplace
Person White Person White Person White Person White Person White Person White
That's 1 in 6 people

What form(s) of harassment have you experienced at work?

forms of harassment

The Realities of Reporting Harassment

What was your experience?

Harassment Experience

Of those that did not experience harassment in the last 12 months

Person White Person White Person White Person White Person White Person White Person White Person White Person White Person White
5 out of 10
believe they would feel very comfortable reporting harassment
8 out of 10
believe they would feel at least somewhat comfortable reporting harassment

But of those that did experience harassment in the last 12 months

Person White Person White Person White Person White Person White Person White Person White Person White Person White Person White
Only 3 out of 10
reported their harassment experience

Next Step

Don't let this data scare you, let it ignite you. Here's how you can act.

Methodology

The State of the Community survey was a collaboration between Portland Women in Technology, SurveyMonkey and Planet Argon. The survey was launched at TechFest NW in early April 2018 and remained open for over three weeks. It was distributed organically through community members via internal slack groups, mailing lists and social media. 804 people responded to the survey.

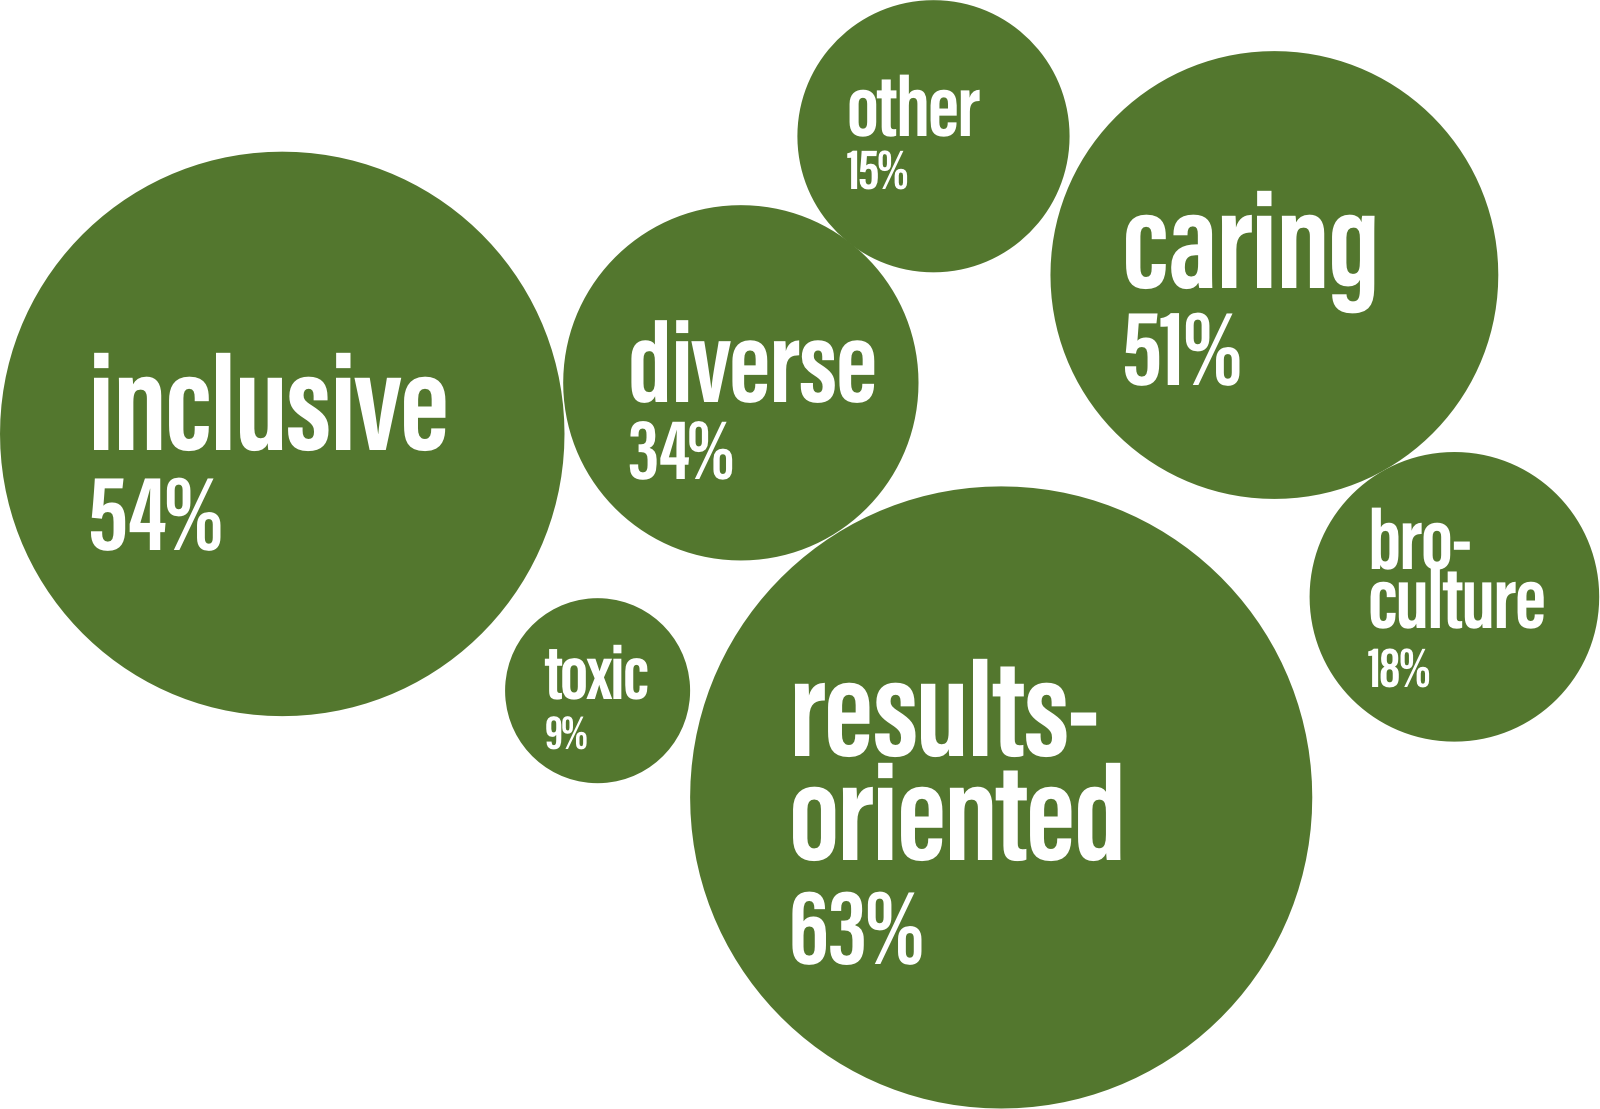
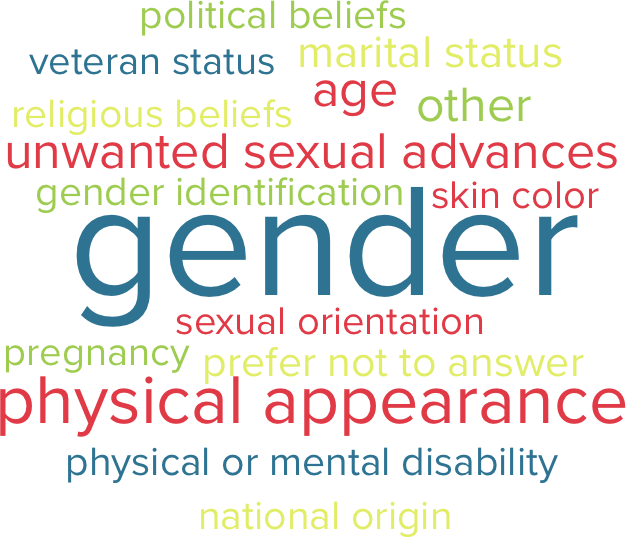
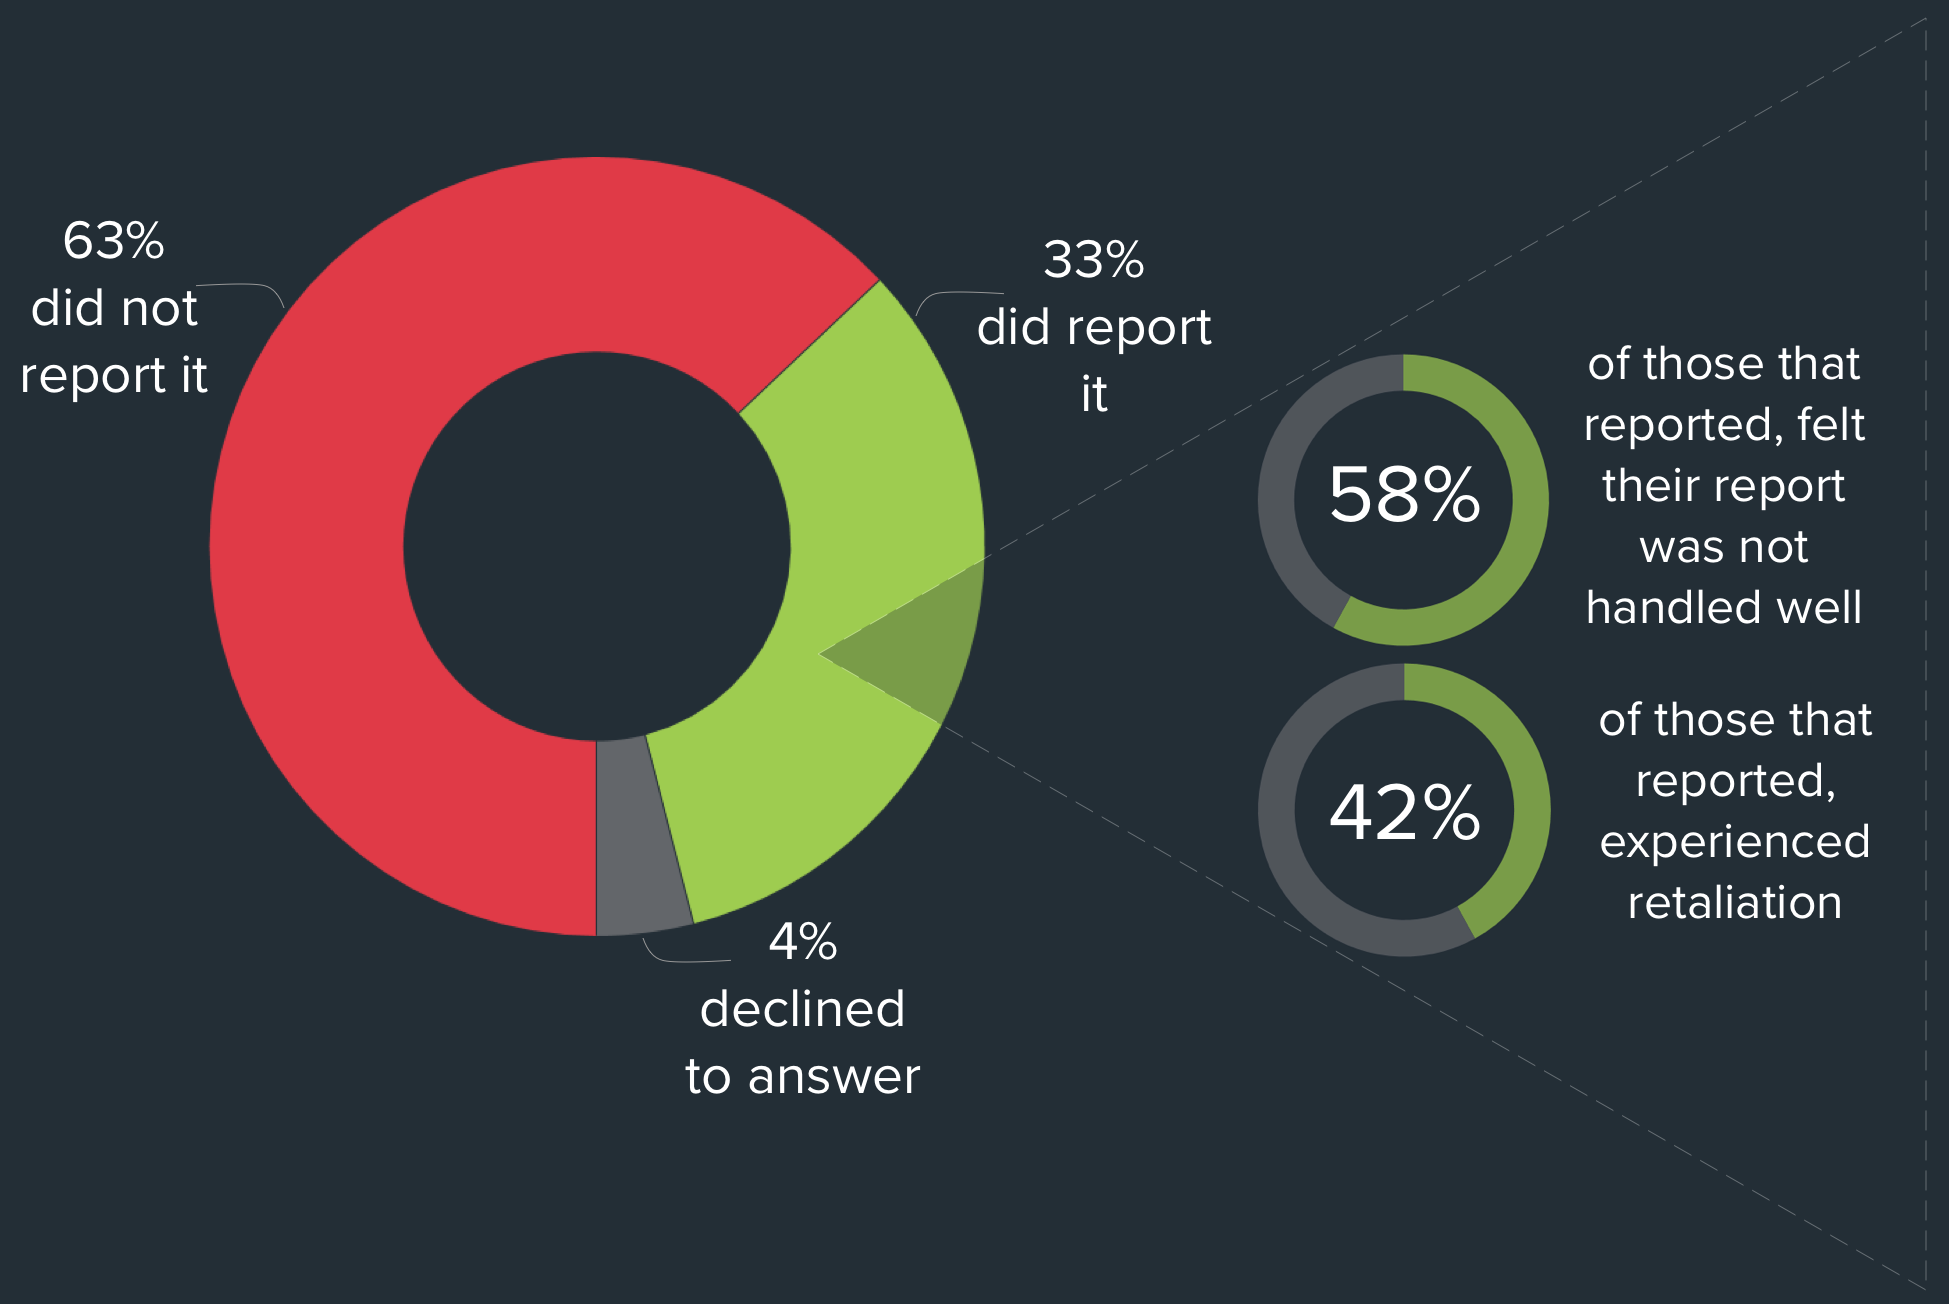
Profile of the respondents:

  • Gender: Women 81%, Men 17%, Gender Non-Conforming or prefer not to answer 2%
  • 68% members of PDXWIT
  • 87% working full time
  • 53% have worked in tech 6+ years
  • 92% hold a college degree
  • 96% in prime working age 25-64
  • American Indian/Alaskan Native 1.4%, Asian/Pacific Islander 10%, Black or African American 2.5%, Hispanic/Latino 4.5%, White/Caucasian 82%, Prefer not to answer 3%, Other 2% (note: respondents could select more than one option)

* Important note: One of the questions in the survey asked respondents to specify their gender identity. This question was multi-select–which means respondents could select more than one gender identity descriptor. All data points within this survey include all individuals, regardless of gender identity, EXCEPT the data points denoted with an asterisk (*) in the title. In these situations, only the individuals who specified “man” or “woman” are reflected due to the fact that the sample size for other gender identities was too small. PDXWIT is committed to serving all people in our community and is constantly iterating our processes to ensure this happens. If you have ideas for improvement, or other feedback related to this survey, please contact .

About Portland Women in Tech

PDXWIT’s thought leadership and advocacy is unparalleled.

Portland Women in Technology (PDXWIT), founded in 2012, is a 501c3 non-profit with the purpose of encouraging women to join tech and supporting and empowering them so they stay in tech. What started out as a small group of 15 women meeting socially at a local bar has turned into a highly-engaged and active community of over 5000 people–inclusive of allies–which represents nearly 30% of Portland’s tech workforce.

The organization works hard to be as inclusive as possible of all individuals and welcomes and affirms non-binary and trans people as a matter of principle. The organization has partnered with over 80 tech companies, over 40 of whom are providing ongoing support of the organization as sponsors.